
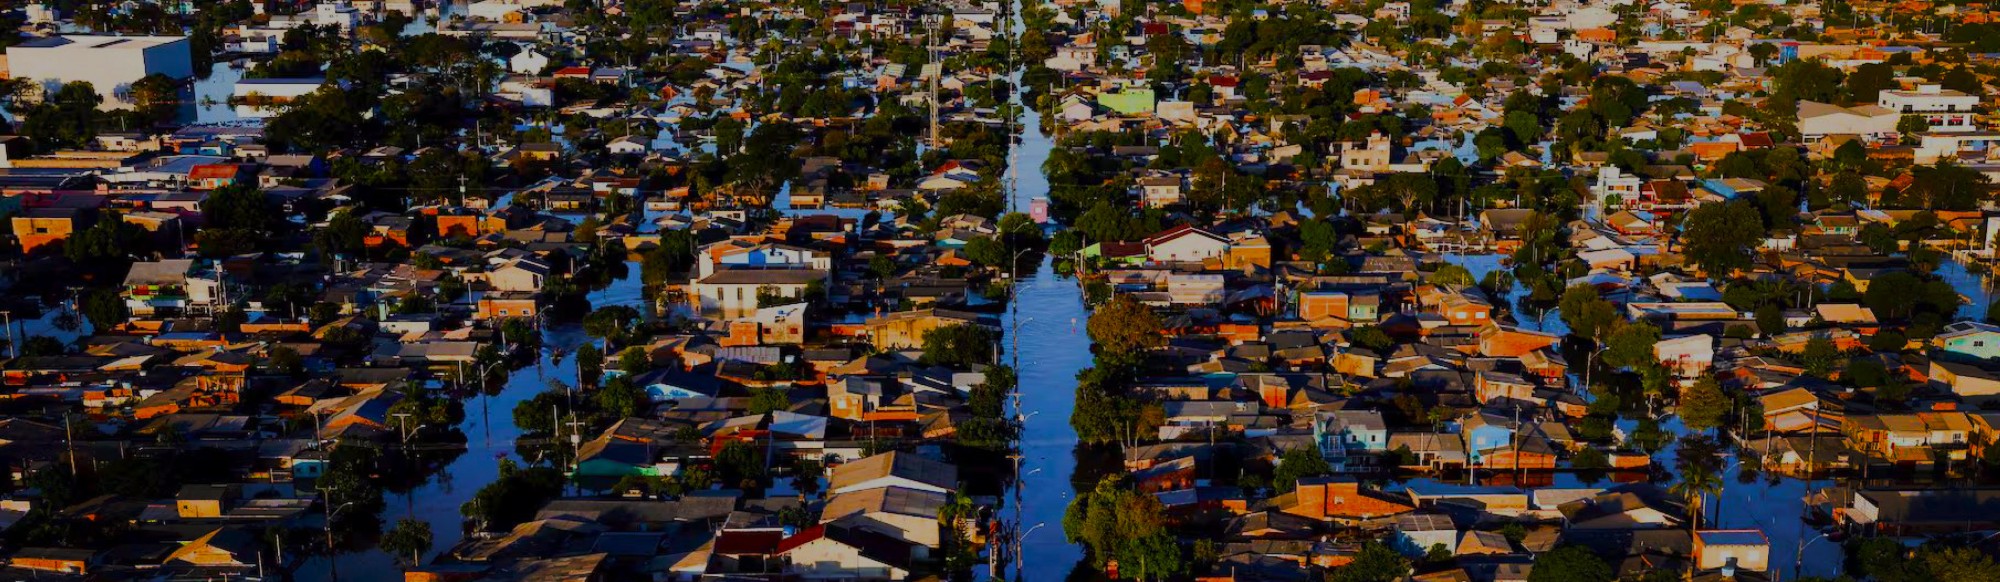
How climate shocks become financial shocks, and where intervention can stop the cascade.
A causal model built on Anthos and presented at NYC Climate Week, September 2026.

Reach out if you'd like to support this initiative.
A causal model, built from 300+ published studies and 400+ equations, that traces how climate hazards move through insurance, housing, mortgage credit, municipal finance and financial markets.
Every institution can act rationally and the whole system can still come down. No one has quantified how big the effect of insurance leaving a market could be, or where to intervene before a local shock becomes systemic.
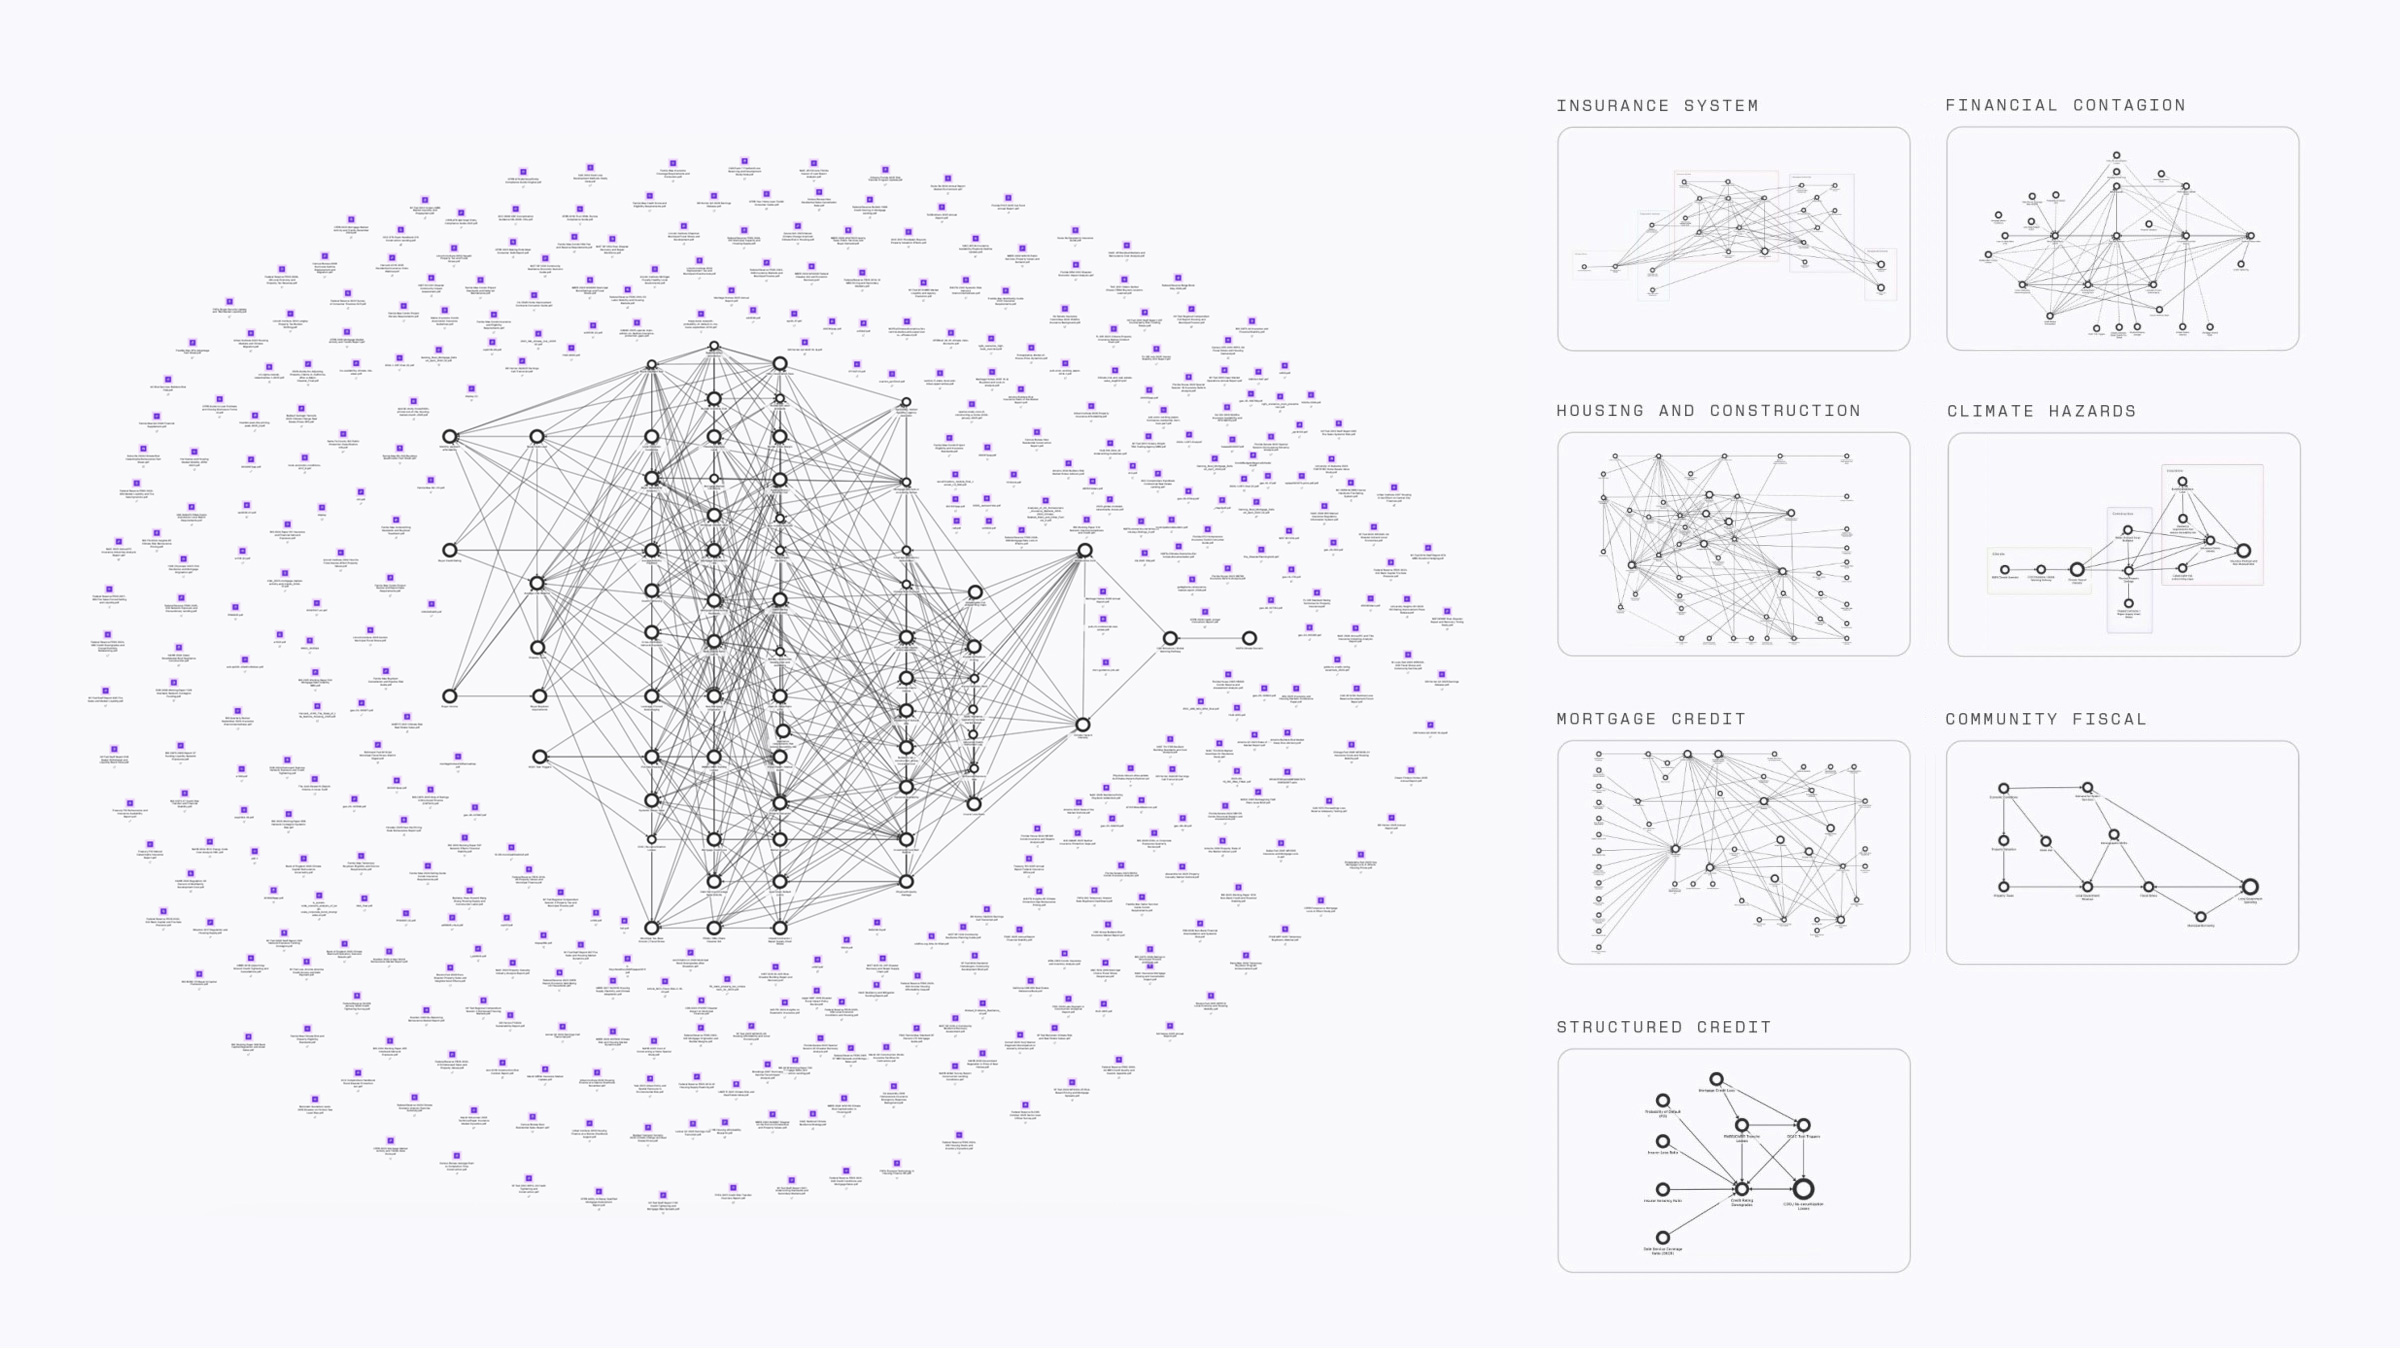
pieces of published literature synthesized into one causal model.
equations adapted from that research and connected into a single system.
connected subsystems, from climate hazards and insurance to structured credit and financial contagion.
The domino effect.
Every part of the system can behave exactly as it is supposed to, and the whole system can still come down as a result. Insurers reprice or withdraw, lenders tighten, property values adjust, and each decision is rational on its own.
No one has fully quantified this. Everyone senses that insurance leaving a market is dangerous, but not how big the effect is or what to do about it. So the risk is underestimated, or assumed to be someone else's problem. Our aim was to simplify the complication without eliminating the complexity, which is irreducible.
One map of a system no single institution sees.
The model links seven subsystems that are usually studied, regulated and managed separately, so their interactions can be traced in one connected causal structure.
How a local shock becomes systemic.
The transmission mechanism is very similar to the 2008 financial crisis. Losses in one part of the system weaken balance sheets, trigger deleveraging and asset sales, and carry stress into otherwise unrelated markets.
When institutions liquidate assets to meet capital or liquidity needs, a local shock can cascade into the broader economy. Lower-quality mortgages are offloaded first, and when that is not enough, good assets follow.
The cascade, simulated.
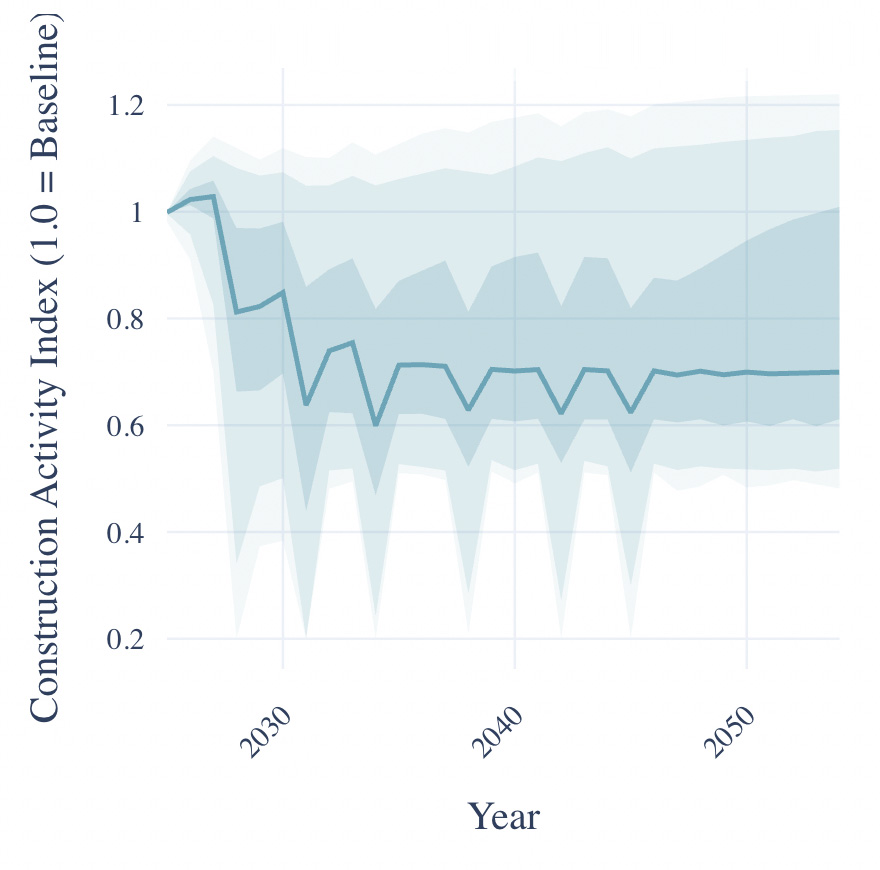
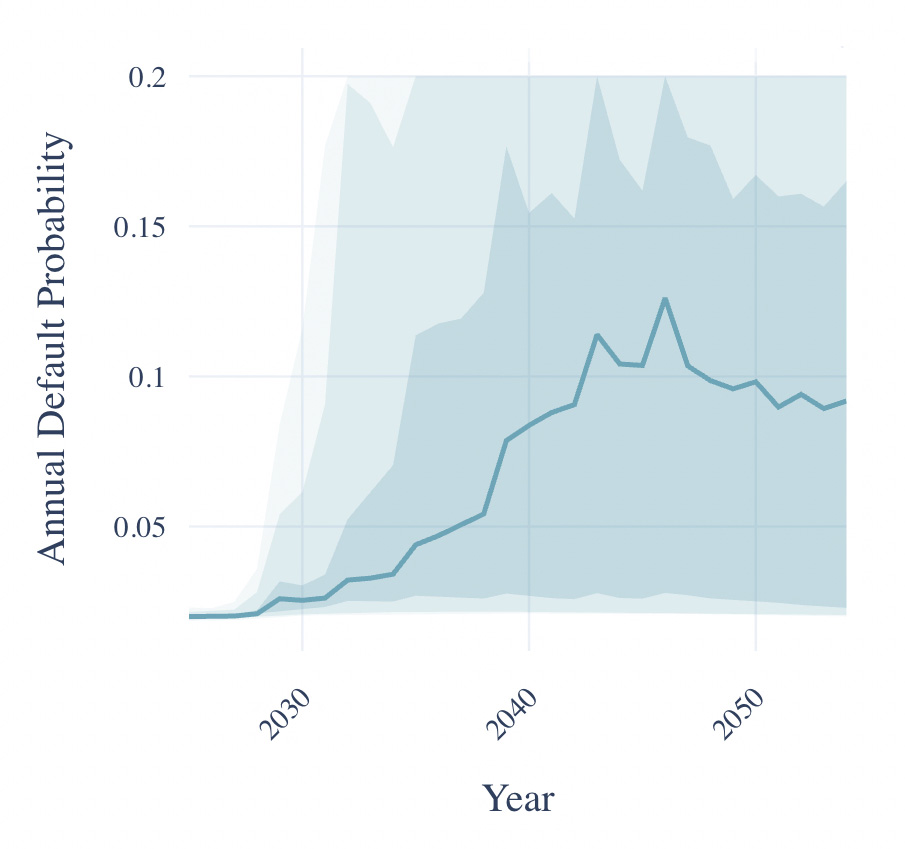
In the systemic scenario, the model follows the cascade over three decades. The solid line is the median outcome, and the shaded bands show the spread across simulated runs.
Construction activity
Construction activity falls to about 70% of baseline in the early 2030s and stays there through 2055.
Mortgage defaults
The annual probability of mortgage default climbs from about 2% to a peak near 12% in the mid-2040s, and is still around 9% by 2055.
Where intervention can stop a local shock from becoming systemic.
Once reviewed and calibrated, the model is designed to show where each lever acts in the cascade, and what second- and third-order effects it sets off elsewhere.
FAIR plans and reinsurance facilities.
Reduce exposure at the source.
Price risk while protecting access.
Hardening, with proof through metrics.
Shared exposure and vulnerability metrics.
Buyouts and condemnation of the most vulnerable real estate.
Built for the decisions ahead.
Stakeholder-specific decision maps
Show how the same contagion pathway affects insurers, banks, asset managers, regulators, finance ministries and municipalities, and where each can intervene.
Policy and regulatory
stress-testing
Test interventions before they are implemented and identify second- and third-order consequences across the system.
Tail-risk and non-stationary scenario planning
Explore how low-probability, high-impact events, including severe climate hazards and tipping points, could propagate through insurance, property, credit and financial markets.
The same approach applies wherever stress moves through connected systems, from biosecurity preparedness to grid reliability and stranded assets. It is most useful when the future is likely to differ sharply from the past, and each stakeholder holds only part of the picture.
A map, not a forecast.
The model does not predict exactly what will happen. Like early map-making, it charts how the pieces connect so institutions can see the system as a whole. And like early maps, it will contain features that turn out to be wrong until they are tested. That is why review is the next step.
What the platform made possible.
Our design partner, who has worked with teams of modelers, expected this to be a multi-year effort that would require bringing in a dedicated modeling team. On Anthos, the research synthesis and equation work came together in a single causal model that experts can read, question and review.
